Interpreting Stream Flow Data Related To Fishing
One of the tools I use that accounts for many successful days on the water is the online stream flow charts. These charts, when used properly, help me determine the river conditions, as well as time the runs of steelhead and salmon in my area while sitting at home.
But, just looking at the numbers online is useless to the untrained angler, and most anglers are confused by the numbers and have no idea how to use these charts as tools for fishing. But I will show you in an easy-to-understand way.
Key Takeaways
- Water Clarity: Different rivers rise, drop, and clear at different times. I will explain how the online charts can tell me the water clarity and fishing conditions.
- Steelhead Runs: Steelhead fishing is generally better when the river is dropping. Being on the river just as the river clears can be fantastic fishing. The charts help me predict these times.
- Temperature: Trout and steelhead fishing can be good or bad based on water temperatures. You can get the temperatures online and even use historical data to aid in determining good times to fish.
- Selecting Rivers: Knowing how the raw data relates to river conditions and how fishing is related to those conditions, I can determine which river or stream is best to fish and which ones to avoid. I will show you how.
Know The Fishing Conditions From Home
Flow data, flow rates, online hydrographs, whatever you call it, knowing where to get online stream flow reports, how to read them, and how the numbers correlate to fishing is an important tool for all river anglers.
I can tell you with almost exact accuracy the water height, water clarity, and even what the color of the rivers I fish and guide on will be like, even if they are two hours away from me. I do this by using the online stream flow charts provided free by two websites.
I use these online websites almost as much as I use the weather app. Both are invaluable tools and I use them together most of the time.
The stream flow charts have saved me from driving an hour to a flooded river or even a frozen river. They have enabled me to find alternate rivers that are in good shape, and I can do this from the comfort of my home.
I’ll explain the process I use to give me accurate predictions of how the river will look, based on the numbers.
The two websites where you will find the information are:
- USA – USGS Current Water Data for the Nation (US Geological Survey Site)
- Canada – https://wateroffice.ec.gc.ca/mainmenu/real_time_data_index_e.html
Reading The Online Stream Flow Charts
There are areas within the river known as water stations, or reading stations, where the flow readings are taken. They are usually small gauges that most anglers never see. I recommend using the closest station to the area you want to fish. They usually list them as the closest town.
I also recommend using the same measuring station each time since the numbers from different stations can be different due to incoming tributaries or other factors.
Anglers will have different ways to read the charts.
Things You Need To Know:
In the USA, the charts show you cubic feet per second and discharge. In Canada, the charts show you meters per second for discharge, and water levels in meters.
Do not worry about what the numbers actually mean. I will explain why I say this below when I show you how these numbers correspond to fishing conditions.
Cubic Feet Per Second: denoted as ft³/s or “cfs,” it represents the amount of water enclosed in a cubic space that is one foot tall, one foot wide, and one foot deep, moving one foot in one second. As the value increases, it indicates a greater volume of water passing the measuring station at any given moment. I do not focus on this number much.
Height: Both websites will show the height of the river in feet or meters. I use the height reading the most, and I learn how the height of the river corresponds to the speed and clarity of the river.
Temperature: Both websites allow you to pick and choose which parameters or readings you would like to see, and one of those is stream temperature. The temperature data can be used in the summer to help determine if the river is too warm to fish. I do use the temperature readings to determine the best time of day to fish for trout in the summer, but overall, I use the temperature readings the least.
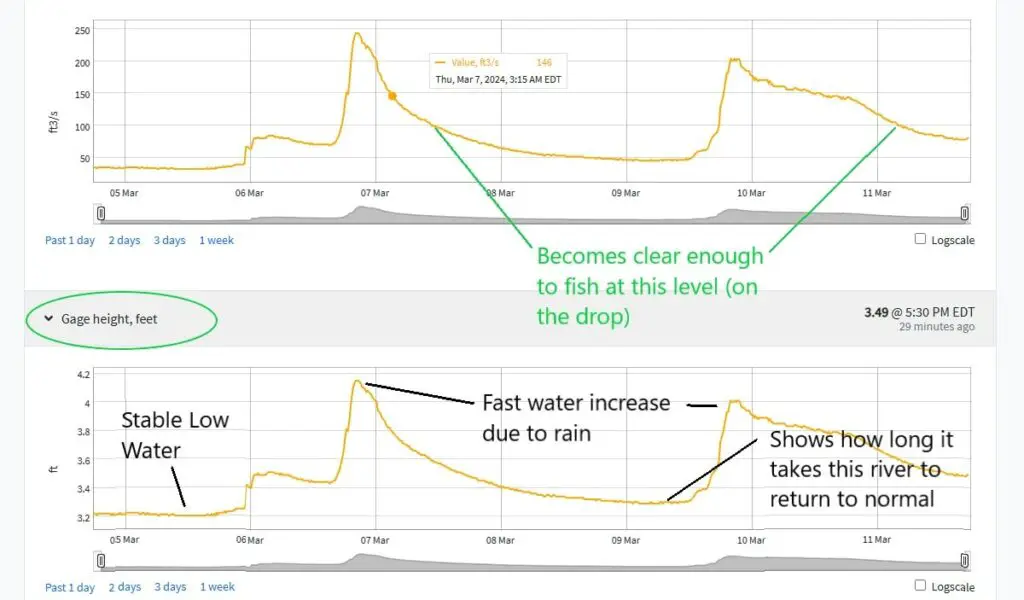
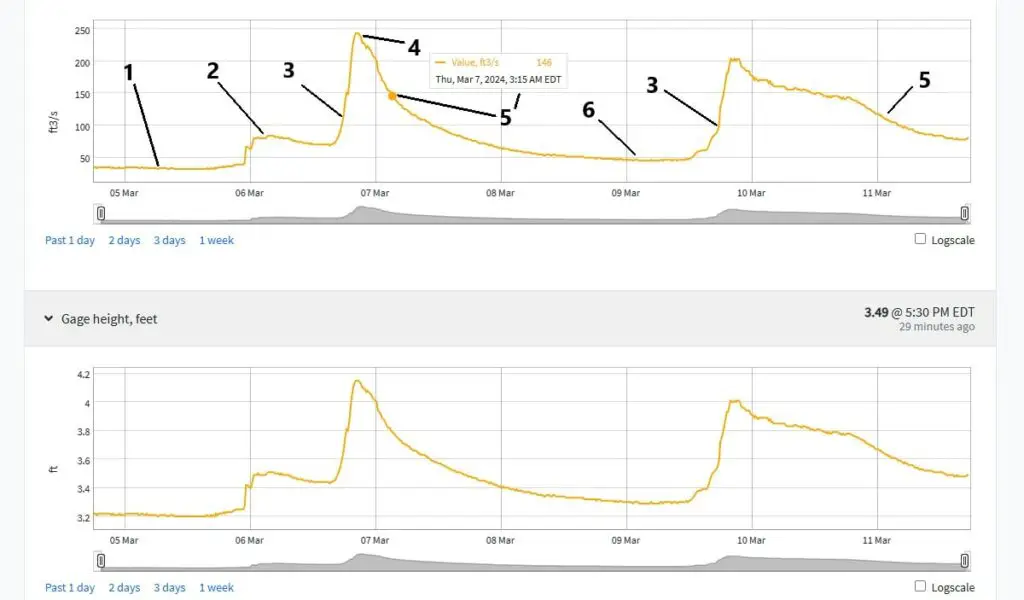
Above is a sample trout and steelhead river. The top chart is cubic feet per second. The lower chart is comparible height in feet.
A rise from 3.2 to 4.2 is a one-foot rise in water, which is a lot of water and can quickly dirty the water. Keep in mind this is only an example and there are other factors to consider.
NOTE: A rise of one foot of water at the monitoring station could be a three-foot rise in water in a narrow section of the river because the water does not have the ability to spread out and up onto the shore.
What the numbers on the chart mean:
- 1 – Baseline or low water level
- 2 – A slight bump in water due to light rainfall – Water clarity is not affected much. It is still good to fish.
- 3 – This is where the water clarity becomes to dirty to fish due to a fast spike in water. Fast increases like this are due to a short burst of heavy rain
- 4 – This is the peak height and flow. Remember this.
- 5 – The river is on the drop and this is where the water starts to clear just enough to become fishable. This might vary depending on the rate of the dropping water.
- 6 – This is how long it takes the river to stabilize and almost return to baseline or clear water.
How To Record and Decifer The Data As An Angler
There are so many variables to determining how and when the river is good to fish or not good to fish.
For this reason, until I get enough data and learn the river well, I will record the conditions each day I fish over months or even years (unless the conditions are exactly the same). I use very short notes and will show you a screenshot of my personal notes below.
Looking at the above chart with the numbers, if I arrive on the 5th of March and then I see the water is low and very clear when I get home, I will go to the charts and record the number.
If I am fishing on March 6th and arrive at noon and the water is clear, but it’s raining, and at 5:30 pm, I notice the water is too muddy to fish, I remember the time so I can look at the online charts later to see at what level the water was at when it got too muddy. On a day when the river is rising. My not could look like this.
- Noon – Clear but rising, due to rains
- 2 pm – 16-inch visibility – the water looks like it’s rising about three inches up on the bank.
- 4 pm – 10 inches of visibility – still raining hard – color is turning brown.
- 5 pm – water is 4 to 6 inches of visibility and is muddy brown.
Then at home, I would update each point with the related number from the charts. I can use those numbers combined with my observations to predict water levels, colors, and heights for future fishing trips with similar conditions.
I would do the same on a day when the water is dropping and going from dirty to clear, but I would be sure to indicate the water is dropping.
- 6 am Water dropping fast – 8 inches of visibility, brown color – height 4.1 on the charts, stopped raining at 11 pm last night with peak height at 4.5.
- 9 am – 12 inches of vis, sunny out, height is 3.8 on the drop
- 11:45 am – 15 inches of vis – height 3.6 – sunny – water is greenish brown color.
- 3 pm – 18 inches of visibility – height 3.4 – water is pea green, fish are biting.
Based on those numbers, I can see how fast the river drops from its maximum height to fishable levels, as well as water color and clarity. I also included when it stopped raining or when the river peaked, so in the future, I can gauge how long it takes from peak to 12 inches of visibility (which is fishable).
Note: A higher peak level might take longer to clear. The river might also clear at a higher number than it would at a lower peak level because sometimes it’s “time” and not “water level” that determines when the river clears. You can see this in my notes below.
Therefore, in a similar situation in the future, if I want to go fishing after a rain and I’m not sure if the river will be flooded or not. When I check the water charts and I see the river is at 3.9 at 10 pm the night before, and providing there is no more rain in the forecast, then by 6am, I know the the water clarity should be good enough to fish.
I record the days when changes are happening. If the water is rising, dropping, getting dirty, or clearing. Remember the times when you notice these changes and record it based on the charts.
Recording the numbers over many days, months, and even years, allows me to see trends such as how fast the water will dirty based on how fast the water rises and other conditions such as snow melt, heavy rain, or light rain over a day or two. I can even see how cloudy days and sunny days increase or decrease water level drops.
I can also predict how fast the water clears based on how fast or slow it’s dropping.
I have found that a river might be clear enough to fish at 3.5 feet on the chart when it’s dropping, but that same river could be muddy and unfishable at the same 3.5 feet when the water is rising. Rising water is normally water getting dirty while dropping water is normally clearing. It makes a difference on the numbers as you will see below.
I record my notes on an app on my phone.
Over time, my notes will have many mini notes so I can reference back to help me predict what the river looks like based on the current data:
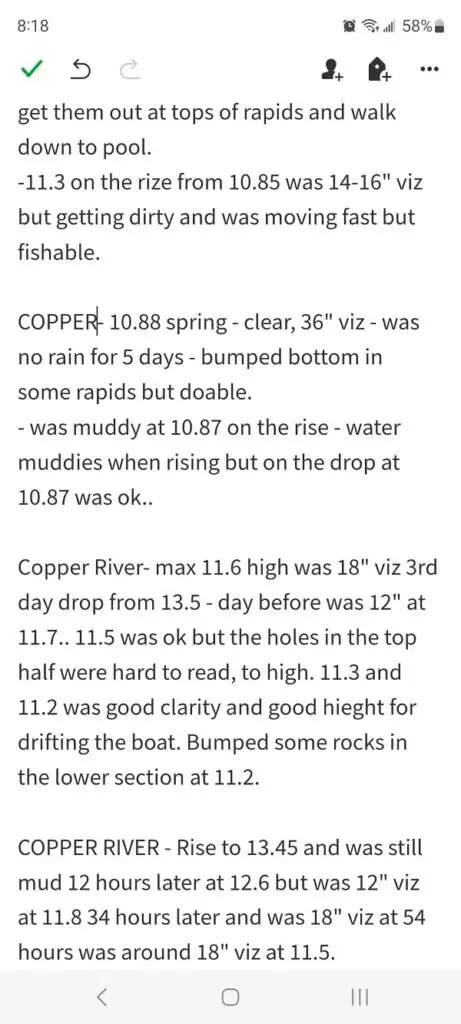
In this screenshot, the number doesn’t matter if it is height or Cf’s as long as I always use the same reading. Each number helps me determine future conditions at a later day.
Notice in my notes, I say the water was muddy at 10.87. But I also mentioned another day the water was 18″ clear at a higher level of 11.6. dropping or rising water can affect clarity at different heights.
NOTE: I have noticed that at times, the data on the website is delayed by 3 to 6 hours (or more). Keep this in mind if it is still raining or if it has just stopped raining. Also, the river can still rise for an hour or more after a rain.
Multiple Rivers
Different rivers drop, rise, muddy, and clear at different times.
Over time, I can make notes on multiple rivers in my area, so if I have determined one river clears 36 hours after peak, and is still too high and dirty, I know another river clears 12 hours after it peaks, and I should go and fish that river instead.
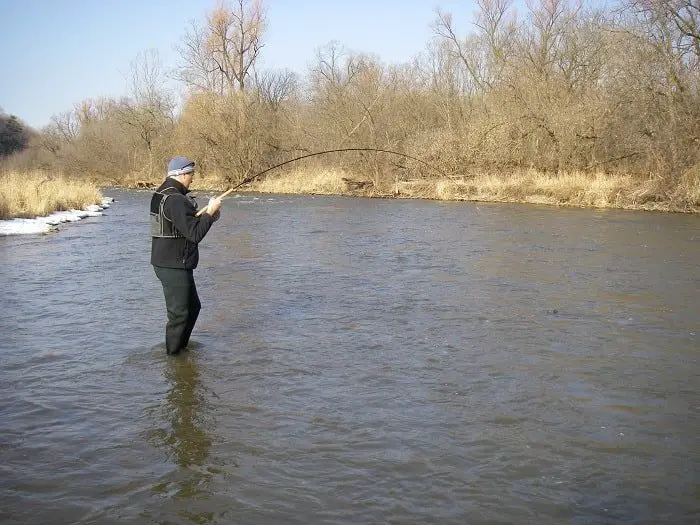
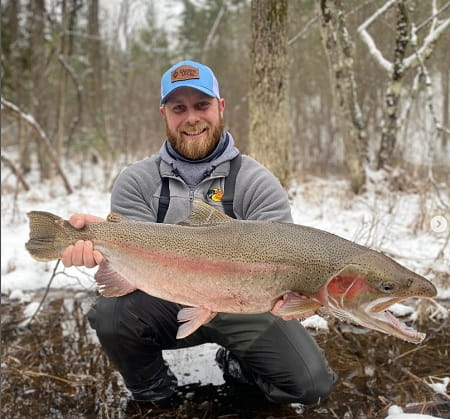
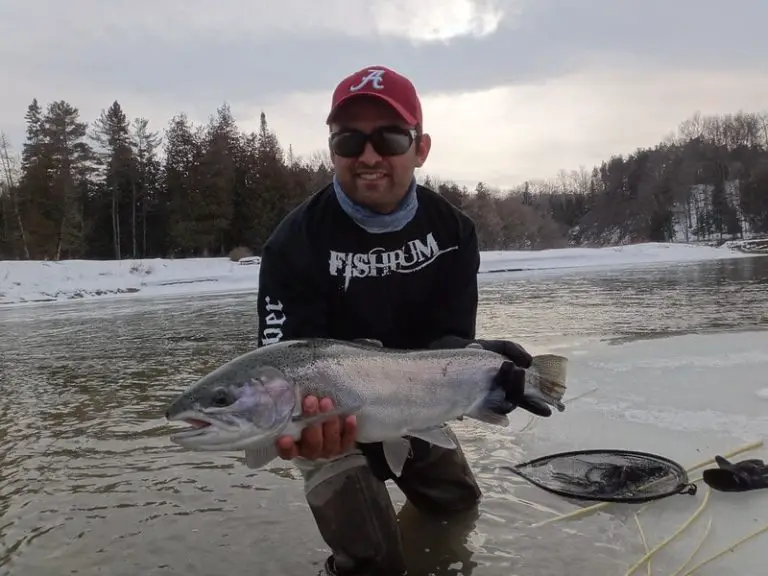
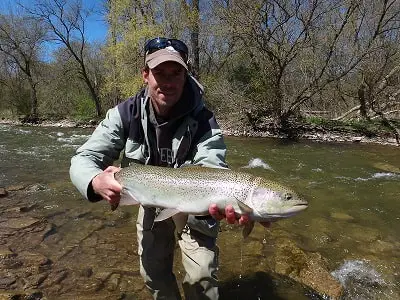
This allows me to fish good rivers at good times, which means I can be on different rivers just as they are perfect. This is great when steelhead fishing and determining the runs and when to be on the water.
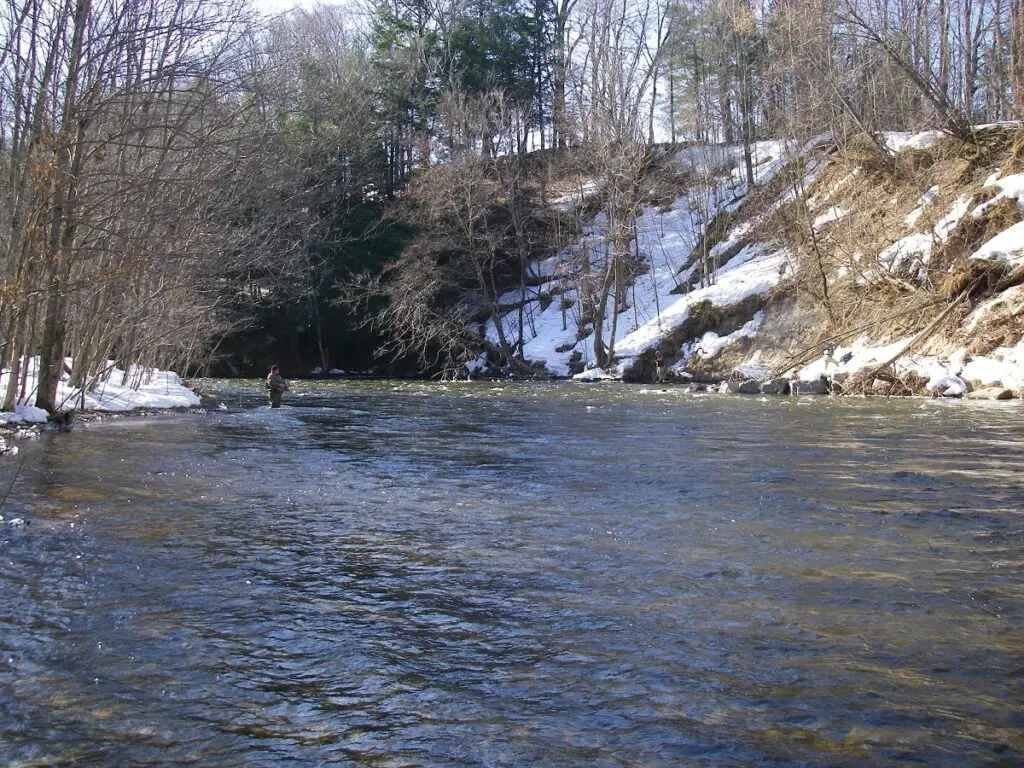
If you are a steelhead angler, some of the best fishing is just as the water has cleared enough to fish (14 to 18 inches of visibility).
Being able to predict this has provided my clients with many fantastic days on the water when other anglers are fishing another muddy river and catching nothing.
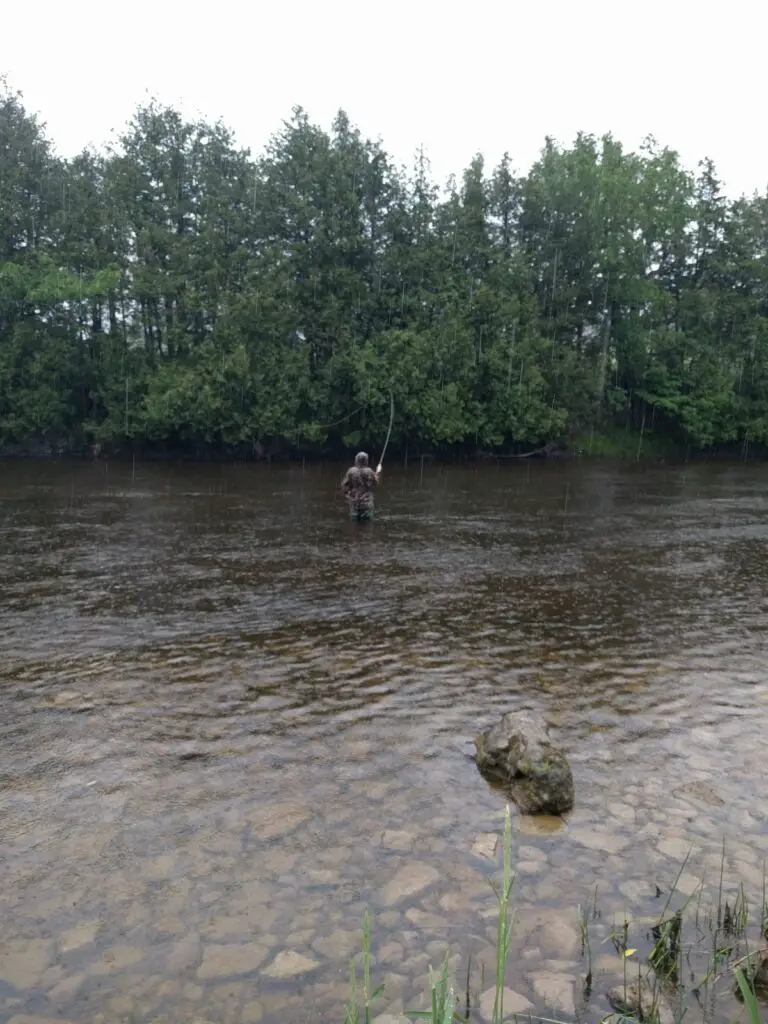
Being able to predict high and muddy water has saved me from showing up to the river when it’s flooded, unfishable, and potentially dangerous, and having a really bad day.
If there is anything I missed or you have a question or suggestion, let me or other readers know.
Tight Lines
Graham